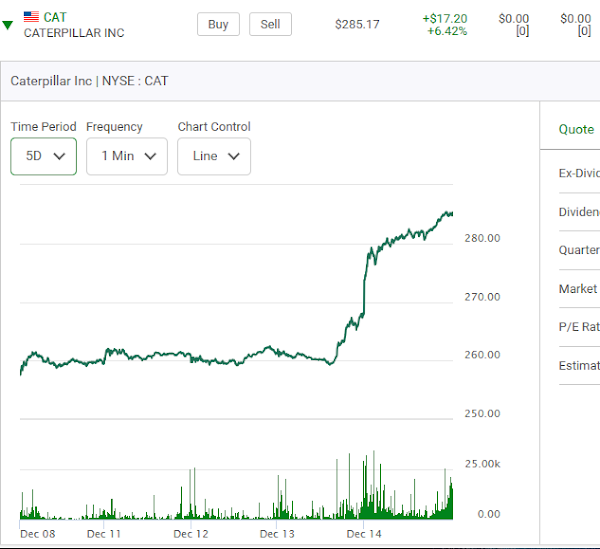
This observation totally defies logic. The markets go up somes days and down some days. It's something like 50:50 right? How do you explain this? Here is how Caterpillar traded on Thursday Dec. 14th.
Yes Caterpillar is on a role.
It is up 14 of the last 15 days. Now here is the only news I could find on it this morning.
This isn't really news because it's dividend was never really in question. Come to think of it, it's really bad news given that earnings were up strongly in the last quarter. Why isn't the company sharing it's profits? Is it buying back shares? Now here is a chart from September showing how Caterpillar gave up a gain on a Friday. It could happen again?
So now what? Look at this.
It's the 285 Puts on the close today with only one day to go. Look at the open interest. ZERO! Look how cheap they are. Couldn't the stock retrace half of it's gain? Why aren't traders looking at this? Even if I am wrong I find it so strange that traders do not see the value in this! On the flip side here is the open interest on the Calls. All of this is so interesting to me. Now a look at the Calls.
All of these traders are hoping for a pop on the opening and some traders are willing to pay money for the $290.00 Calls.
Here shown about was its Fridays morning chart and here are some of the Call and Put printouts. First the Calls. Remember they closed at $1.86.
Now the Puts near the opening. Remember they closed at $1.89.
Then this. Two hours into the trading things were holding steady. Where was the big dip we were hoping for? What happened to the hope of a five or seven, or even $15.00 decline?
Now here is the chart on the day.
Finally this at the end of the day. This series of Puts expired "out-of-the-money" and the final trade was at $.05..
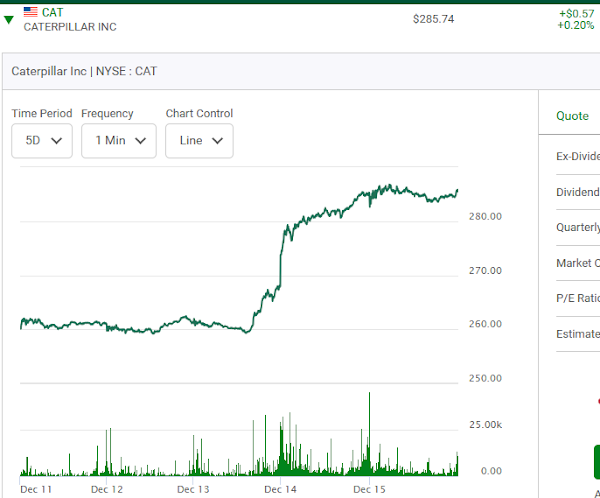
The stock somehow was steady all day and both the Call and Puts holders got burnt. Here is the new five day chart. Are there lessons to be learned? Well if the open interest in a series of Puts you are looking at is zero, you should spend more time thinking why that is. Secondly if you were in the position of hanging onto the 385 Puts you had opportunities to get out and get most of your money back. Maybe in future trades when you find yourself in the same situation let this experience be your guide. Yet that doen't mean it never happens.


Comments
Post a Comment