It's earning report came out and it fell. Look at this.
Now this report. The stock dropped as revenues went up. Go figure.
How did the Put options do?
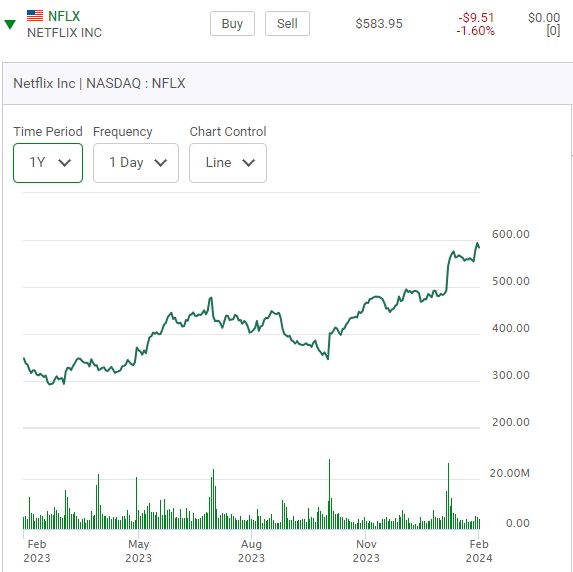
These are the 90 series of Puts, the series most traders would be attracted to if they were considering playing the downside for a one day trade. They closed the previous day, the day before the release of this news for $5.80. "Netflix" is another stock also in the same space and it's stock also gets whiplashed around like this on it's earning reports. See it's one year chart. The stock has doubled in the last year and is widely followed by option players.

All of these companies in this space fight amongst each other for paid monthly subscriptions. Whoever has the best platform of the day will steal market share away from their competition while at the same time analyst weigh in on their thoughts on how the industry in it's entirety is evolving. "Disney" and "Lions Gate" are two other well known players in this space. "Lion Gate" just had a lousy earning report. My thoughts on all of this. 1) "Netflix" is definitely a stock to watch/play on it's earning releases. 2) It's easy to be an armchair player making "I told you so" comments on "just what is happening" situations. Having said this I want to show you a one year chart on "Roku".

Why am I showing this? Well if "Roku" was going to fall for whatever reason it could "freefall" down to somewhere just below the sixty dollar price range. The potential for a "freefall" thanks to known chart formations are something else option players should factor in when making buying decisions. Now let's look at the "open interest" numbers in next weeks Calls and Puts. These are the series of Calls and Puts closest to where the "Roku" is currently trading. There is no interest in them yet look at the high daily volume of trading! Traders where in and out. My last blog on "Deere" also showed the same thing. Seasoned option players are afraid to jump in into rebounds to quickly. I get it .
One last insight. Two random printouts on two different longer term "Roku"Call option positions. Two of many option series. Yet it might be months and months before this stock starts to rebound..
Option traders should not be running into Call option positions when this company has has so much competition. Here is the action on the following open. (Monday Feb 19th was a holiday) on the Tuesday morning in the first forty five minutes of trading.
Let's now look at the June 21th Calls. Let's see how much it has dropped further down. That might be a good entry point.
They are $6.50 down from$ 9.50 on The Friday close. Here now is it's five day chart.
. To be continued. A March 17th update, one month later and the sames series of Calls.
When a stock drops this much after a relatively good earnings report it makes you wonder whats going on.