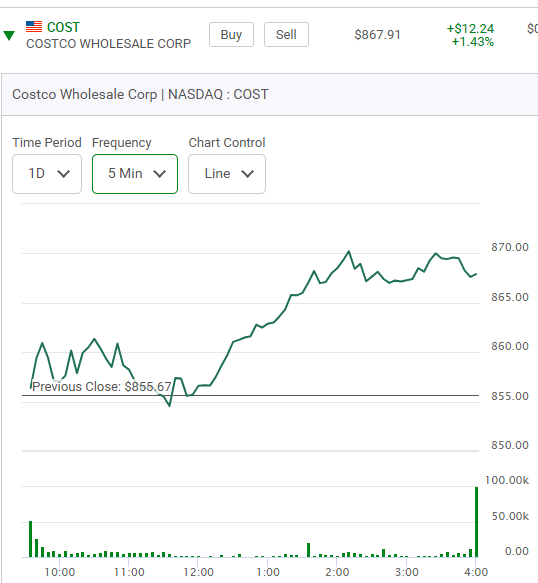
The options on Costco that I am about to show you don't expire until the end of the week and here is the current one day chart on Costco. It's a Monday. What do you think of this chart? Will it go up or down next? Nobody knows.
Here is what the DJIA is doing?
Is the stock now hitting a point of resistance? Once again, it's really to early in the week to tell.
There is an "open interest" Put number from the previous session of only five contracts. Traders as of the close last Friday had no real interest in playing it down. Recent history of course tells us not to buy Puts on Costco. Why try to go against an upward trend? Why then does this chart catch my attention? It's the leverage I know the options on this stock offers. Stocks in this price range can drop five or ten dollars in only a matter of an hour and the week still still has 29 hours of trading time to go. Could buying in here now on the downside be a good short term trade? That's the question. Here is a printout of the action at 1:21 p.m.
The Put options have dropped from $775.00 to $550.00. in just over 30 minutes. The stock is up over $12.00 on the day. Why try to fight it? Can you see how dangerous this game can be? What ended up happening to these Puts at the close? Here is the answer and a look at the one day chart.
If we look at the open interest tomorrow we will be able to sell how many traders got in and out.
One takeawy. A five dollar move on a stock in the $800.00 plus price range doesn't mean a stock is going to stop there. Now the same Costco Puts trading on Tuesday morning. The open interest now is 156 meaning about half the contracts that where opened yesterday were closed out, presumably at a lost. They are not particularly desirable contracts to be holding.
Now this. The markets were closed for some reason on Wednesday June 19th. These options now only have two days trading life in them. Next. Thursday, what a chart.
Now the famous Puts we are watching. Notice they traded down to a low of $1.45 in the morning.
At 10:00 a.m. they jumped up to $9.79. Here is how they finished off the week. They went up even higher as Costco was down over $14.00 on the day.
Pay attention to this triple witching concept the next time around.**Costco traded down $7.36 on the week. He is it's five day chart which actually included the Friday of one week ago because we just finished a four day trading week.


Comments